
MCP Servers for Observability: Datadog, Grafana, Sentry, Prometheus and Where Read-Only Lives
An alert fires, the error is in Sentry, the latency spike is in a Grafana panel, and the trace that explains both is sitting in Tempo. Pointing a coding agent at all three and asking "what changed after the 14:00 deploy?" is a genuinely good use of MCP. Most of what the agent does there is reading.
Most, not all. Observability servers can create monitors, edit dashboards, resolve issues and, in one case below, call the endpoint that shuts Prometheus down. And everything they return (log lines, span attributes, exception messages) was written by your application and its users, which makes it untrusted input sitting in the model's context.
This roundup covers the servers I could verify from the vendor's own docs or repository, what each one exposes, and where its read-only switch actually lives. Everything here is as of November 2026; these projects ship weekly, so check the linked docs before copying a flag.
The short list
| Server | Maintainer | How it runs | Auth | Read-only lever |
|---|---|---|---|---|
| Datadog | Datadog | Remote, https://mcp.<site>/v1/mcp | OAuth, access token, or API + app keys | mcp_read vs mcp_write roles, org "MCP Write Access" toggle |
| Grafana | Grafana Labs | Local (uvx mcp-grafana, Docker, binary) | Service account token | --disable-write plus a narrow service account |
| Sentry | Sentry | Remote https://mcp.sentry.dev/mcp, or stdio via npm | OAuth or user auth token | Grant only the inspect skill |
| New Relic | New Relic | Remote https://mcp.newrelic.com/mcp/ (EU and JP too) | OAuth (recommended) or user API key | observability:read scope, include-tags header |
| Prometheus | Prometheus project | Local binary or container, stdio or HTTP | Prometheus HTTP config | Admin tools off by default, --mcp.tools |
| Axiom | Axiom | Remote https://mcp.axiom.co/mcp | OAuth or personal token + org ID | Role permissions and query cost limits |
| Langfuse | Langfuse | Built in, /api/public/mcp | Basic auth with project keys | Client-side tool allowlist |
| OpenTelemetry traces | Traceloop | Local, pipx run opentelemetry-mcp | Backend URL | Query tools only |
If you're still choosing the platform underneath, our Sentry vs Datadog and Datadog vs New Relic comparisons cover that side.
Hosted vendor servers
Datadog
Datadog's server is managed and remote. The endpoint follows your site: https://mcp.datadoghq.com/v1/mcp for US1, https://mcp.datadoghq.eu/v1/mcp for EU1, and so on for US3, US5, AP1, AP2 and UK1. The setup docs say the FedRAMP sites aren't supported.
The part worth knowing is toolsets. With no parameter you get only core. You add others in the URL, and you can strip individual tools after that:
{
  "mcpServers": {
    "datadog": {
      "type": "http",
      "url": "https://mcp.datadoghq.com/v1/mcp?toolsets=core,error-tracking&omit_tools=search_datadog_incidents"
    }
  }
}
toolsets=all exists and the docs warn it eats context. Preview toolsets such as apm aren't included in all and have to be named.
Write safety is enforced on Datadog's side. Users need the mcp_read and/or mcp_write permission plus the normal resource permission (Monitors Read, say), and an org setting called "MCP Write Access" must be on before write tools appear at all. The overview page adds that a read-only user's call to a write tool is rejected, and lists fair-use limits of 50 tool calls per 10 seconds and 100,000 per month. For automation, the docs recommend scoped API and application keys from a service account over a personal login.
Sentry
Sentry's hosted server is at https://mcp.sentry.dev/mcp, and you can pin it to an organization or a single project in the path, which also hides discovery tools you no longer need (mcp.sentry.dev):
claude mcp add --transport http sentry https://mcp.sentry.dev/mcp/my-org/my-projectPermissions come as "skills". In the toolkit source, inspect is read-only access to issues, events, traces, replays, releases and monitors, and seer is Sentry's AI debugger; both are on by default. triage (resolve, assign, update issues) and project-management (create and modify projects, teams, DSNs and alert rules) are off by default. When you connect with an explicit token, the README says you can narrow things with ?skills=inspect.
For self-hosted Sentry there's a stdio package, @sentry/mcp-server. Two catches from its README: the natural-language search tools need an LLM provider key configured on the server (EMBEDDED_AGENT_PROVIDER plus that provider's key), and the token scopes it lists include project:write, team:write and event:write. If you only want to read, start from fewer scopes and see what breaks.
New Relic
New Relic's setup page lists three endpoints, https://mcp.newrelic.com/mcp/, https://mcp.eu.newrelic.com/mcp/ and https://mcp.jp.newrelic.com/mcp/, and recommends OAuth. The OAuth client asks for observability:read, and several of the AI-backed tools (natural_language_to_nrql_query, analyze_deployment_impact) only work with OAuth. To trim the tool list, send an include-tags header such as discovery,alerting.
The overview is specific about who can connect: a read-only, manager or product admin role, or a custom role with MCP read permission. Access tokens last five minutes and refresh automatically. The page also warns that tools can act in your account, so use a least-privilege role.
Axiom
Axiom's original local server, axiomhq/mcp-server-axiom, is archived, and its README points to the hosted one. Per Axiom's docs, that's https://mcp.axiom.co/mcp (or mcp.eu.axiom.co to keep results in the EU), with OAuth by default, or a personal access token plus an x-axiom-org-id header for agents that can't do browser login. Besides APL queries it can manage dashboards, monitors and notifiers, so the role you sign in with matters. Axiom suggests setting query cost limits on that role.
Servers you run yourself
Grafana
mcp-grafana (v2.2.0, released 2 November 2026) is the one I'd reach for if your telemetry already lands in Grafana, because it fans out to whatever datasources you have: Prometheus, Loki, Tempo, CloudWatch, Elasticsearch and several SQL databases. It needs Grafana 9.0 or later.
{
  "mcpServers": {
    "grafana": {
      "command": "uvx",
      "args": ["mcp-grafana", "--disable-write", "--disable-admin"],
      "env": {
        "GRAFANA_URL": "https://grafana.example.com",
        "GRAFANA_SERVICE_ACCOUNT_TOKEN": "<token>"
      }
    }
  }
}
--disable-write removes create and update tools. It also removes the raw SQL tools (query_sql, query_influxdb), because the README points out they execute whatever query they're given, so query_sql would happily run a DROP TABLE if the datasource credentials allow it. PromQL, LogQL and TraceQL can't express a write, so those query tools stay. Every tool category has its own --disable-<category> flag, and --loki-enforced-matchers can AND a label selector into every Loki query.
One line in the README deserves a highlight: assigning the built-in Editor role to the service account is convenient but "less restrictive" than granular scopes. For an agent, take the granular route.
Prometheus
This server now lives in the Prometheus organization at prometheus/prometheus-mcp, though its container images are still published under ghcr.io/tjhop. The latest stable release is v0.18.0; v0.19.0 is at release candidate and renames the binary to prometheus-mcp and the environment prefix to PROMETHEUS_MCP_. The old variable names are silently ignored after the upgrade, which is the kind of change that breaks a config without an error.
The default tool list is broad, and it includes reload and quit. Those call Prometheus's management API, which Prometheus only enables with --web.enable-lifecycle (management API docs). If your Prometheus doesn't set that flag, the tools fail harmlessly; if it does, an agent can shut it down. The TSDB admin tools (delete_series, clean_tombstones, snapshot) need --dangerous.enable-tsdb-admin-tools, so they're off unless you ask.
--mcp.tools is an allowlist on top of a fixed core set (query, range query, labels, series, metadata, docs and runbooks). Using the v0.19 binary name:
prometheus-mcp --prometheus.url=https://prometheus.internal:9090 \
  --mcp.tools=list_alerts --mcp.tools=list_targets
That gives the agent PromQL and two extra read tools, and nothing that touches the server's lifecycle.
LLM traces: Langfuse and OpenTelemetry
If the thing you're observing is an LLM app, two more are worth a look.
Our Langfuse page lists langfuse/mcp-server-langfuse, which only serves prompts and hasn't changed since February 2025. Langfuse now has a native MCP server at /api/public/mcp on Cloud (EU, US, JP and HIPAA regions) and self-hosted instances. It authenticates with HTTP Basic using a base64-encoded public_key:secret_key, and each key is scoped to one project. Both read and write tools are on by default; Langfuse's advice for read-only use is an allowlist in your MCP client.
Traceloop's opentelemetry-mcp-server is not part of the OpenTelemetry project, but it is a practical way to query traces in Jaeger, Grafana Tempo or Traceloop. Its tools are all searches and aggregations (search_traces, find_errors, get_llm_expensive_traces), which makes it one of the few servers here with no write path at all.
Where the guardrails actually sit
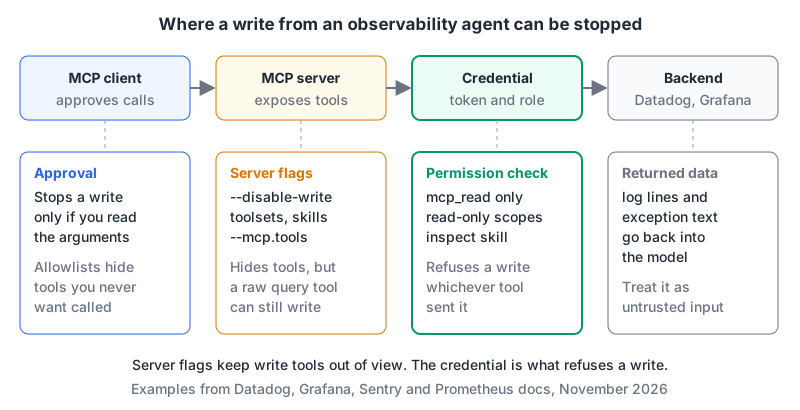
Server flags are useful because they keep write tools out of the model's tool list, so it never tries. But they're a filter, not a permission system. Grafana's raw-SQL caveat shows why: a tool that looks read-only can still write if the credential behind it can. The layer that holds is the credential.
A read-only setup checklist
- Make the credential read-only first. A Datadog service account without
mcp_write, with MCP Write Access off at org level. A Grafana service account with granular read scopes. Sentry with onlyinspect. New Relic through OAuth with a read-only role. - Then trim the tool list. Datadog
toolsets/omit_tools, Grafana--disable-*, Prometheus--mcp.tools, New Relicinclude-tags. Fewer tools also means less context spent on tool definitions. - Treat returned telemetry as hostile. A log line can contain instructions. Our post on tool poisoning and prompt injection covers the defenses that hold up; keeping write tools out of the same session as log-reading tools is the cheap one.
- Remember where the data goes. Datadog notes that its server doesn't send your data to third-party AI providers, but where it goes after that depends on the MCP client and model you use. If logs carry personal data, that's a decision about the client, not the server. Our error monitoring guide has notes on scrubbing PII before it's captured.
- Keep approvals on for anything that writes. If you deliberately enable Datadog's alerting toolset or Sentry's
triage, leave per-call approval on in the client. Configuring MCP servers in Claude Code, Cursor and VS Code shows where those settings live.
My rule of thumb: start every observability server read-only with the smallest toolset that answers your usual question, and add write access per incident type, not per convenience.
Written by AIDToolStack Editorial
Researched from official documentation, specifications and vendor pages, listed under Sources below. Last checked November 2026.
Sources
- docs.datadoghq.com/bits_ai/mcp_server/setup/
- docs.datadoghq.com/bits_ai/mcp_server/
- mcp.sentry.dev/
- github.com/getsentry/toolkit
- docs.newrelic.com/docs/agentic-ai/mcp/setup/
- docs.newrelic.com/docs/agentic-ai/mcp/overview
- axiom.co/docs/console/intelligence/mcp-server
- github.com/grafana/mcp-grafana
- github.com/prometheus/prometheus-mcp
- prometheus.io/docs/prometheus/latest/management_api/
- langfuse.com/docs/api-and-data-platform/features/mcp-server
- github.com/traceloop/opentelemetry-mcp-server
- github.com/datadog-labs/mcp-server
- github.com/newrelic/mcp-server
- github.com/axiomhq/mcp-server-axiom
- github.com/langfuse/mcp-server-langfuse
- github.com/getsentry/toolkit/blob/main/packages/mcp-core/src/skills.ts
- github.com/grafana/mcp-grafana/releases
- github.com/prometheus/prometheus-mcp/releases
Related Posts
Explore on AIDToolStack
Discover tools and servers featured in our directory.
AI Tools
MCP Servers
Sponsor Our Newsletter
Reach thousands of developers who are actively evaluating AI tools, MCP servers, and dev infrastructure. Our weekly newsletter goes to engaged technical decision-makers.
All sponsored content is clearly labeled per our editorial policy.