
Debugging MCP Servers with MCP Inspector v2: Modes, CI Smoke Tests and Common Failures
Your MCP server runs fine when you start it by hand. Then you add it to a client and get a red dot, an empty tool list, or a tool that "fails" with no message you can act on. The client is hiding the wire from you, and guessing at what went over it is slow.
MCP Inspector is the tool for putting yourself on that wire. If you last used it in 2025, a lot of what you remember is now wrong: the Inspector was rewritten as v2, and the protocol itself changed shape in the 2026-07-28 spec revision. This post covers the current versions, how to use each Inspector mode, and the failures I'd check first, grouped by symptom and by client. If you haven't built a server yet, start with our guide to building a custom MCP server and come back.
What changed in 2026
Two things moved under your feet this year.
The Inspector is v2. As of 7 November 2026 the npm latest tag for @modelcontextprotocol/inspector is 2.14.0, published on 5 November. The v1 → v2 migration guide calls v2 a rewrite and says v1 gets security fixes only, on the v1-latest tag. The differences that trip people up:
| v1 | v2 | |
|---|---|---|
| Node | >=22.7.5 | ^22.23.4 || ^24.22.1 || >=26.12.1 |
| Ports | UI on 6274, MCP proxy on 6277 | one web server on 6274, plus an MCP Apps sandbox on 6275 |
| Modes | web, --cli | web, --cli, --tui (plus an experimental mcpdo) |
| Server list | per-browser localStorage | a catalog file, ~/.mcp-inspector/mcp.json |
| Auth token env | MCP_PROXY_AUTH_TOKEN | MCP_INSPECTOR_API_TOKEN (old name still read as a fallback) |
| CLI exit codes | 0 / 1 | 0 to 6, plus a JSON error line on stderr |
The Node floor is stricter than it looks. Since v2.14 it's the patched release on each line from the October 2026 Node.js security releases, and the migration guide warns that npm only warns about an engines mismatch, so an old Node fails later and obscurely. Run node -v before anything else.
The protocol went stateless. The current spec revision is 2026-07-28. Its changelog removes the initialize handshake and the Mcp-Session-Id header, puts the protocol version and client capabilities in every request's _meta, adds a mandatory server/discover RPC, removes ping and logging/setLevel, and deprecates the Logging, Roots and Sampling features plus the old HTTP+SSE transport. Our MCP explainer covers the concepts; for debugging, what matters is that a client and server can now disagree about which era of the protocol they're speaking.
The Inspector exposes that as a per-server setting. The server configuration docs list protocolEra as "legacy" (the default), "auto" or "modern", settable from the command line with --protocol-era. If your server was built against 2026-07-28 and the Inspector talks to it the old way, that's the first thing to fix.
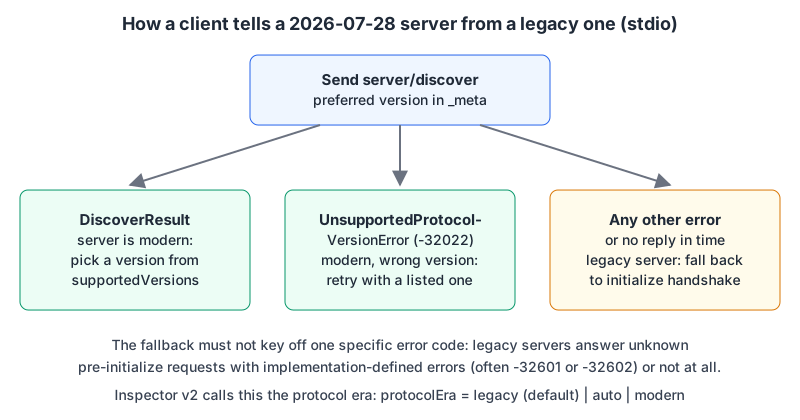
That chart is the probe the stdio transport page tells dual-era clients to run. Note the rule in the footer: the fallback can't key off one error code, because legacy servers answer unknown pre-initialize requests however they like.
Pick a mode
npx @modelcontextprotocol/inspector          # web UI (default)
npx @modelcontextprotocol/inspector --cli    # scriptable, for CI
npx @modelcontextprotocol/inspector --tui    # terminal UI, good over SSH
The mode flag has to come first, straight after the binary name. My rule: the web UI while you're building, the TUI when you're on a remote box or in tmux, and the CLI for anything a machine runs.
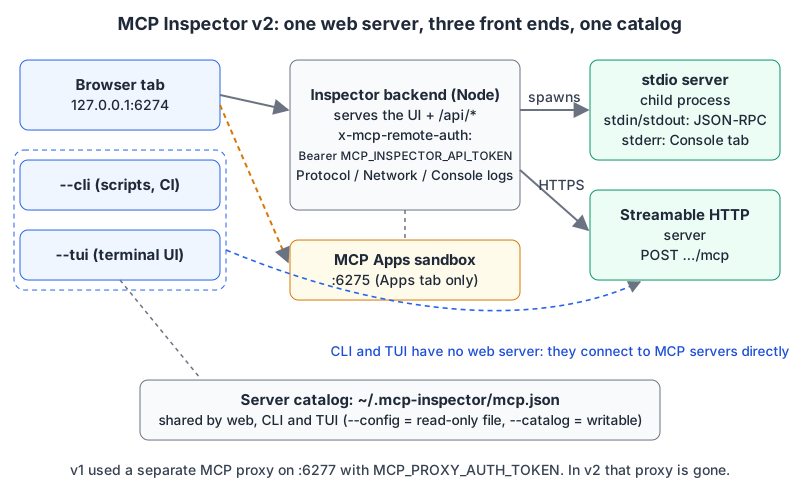
The web UI and TUI give you the same three monitors, per the TUI README: Protocol (JSON-RPC request, response and notification history), Network (HTTP traffic for SSE and Streamable HTTP servers) and Console (the stdio server's stderr). Most bugs show up in one of those three before you've finished reading your own code.
Walkthrough: a local stdio server
- Build, then point the Inspector at the command that starts your server:
npx @modelcontextprotocol/inspector node build/index.js- Pass environment variables with
-e, and put your server's own flags after--:
npx @modelcontextprotocol/inspector -e API_KEY=test -- node build/index.js --verbose- If the server targets the 2026-07-28 revision, add
--protocol-era modern(orautoif you're not sure which era it speaks).
- Open the Console monitor and keep it open. Anything your server writes to stderr lands there.
- In the Tools tab, check for portability flags. The Inspector lints each tool's input schema and marks constructs that a shipping client refuses or handles unevenly, with the path, the problem and a suggested fix. The same check runs from the CLI as
tools/list --strict.
- Call each tool with realistic arguments, including the ones a model is likely to get wrong. A tool that returns
isError: trueis a different failure from a protocol error, and the Protocol monitor shows you which one you got.
Walkthrough: a remote Streamable HTTP server
npx @modelcontextprotocol/inspector --cli \
  --transport http --server-url https://example.com/mcp \
  --header "Authorization: Bearer $TOKEN" --method tools/list
v2 only infers the transport from the URL's last path segment: /mcp means Streamable HTTP, /sse means SSE, anything else stops with Transport type not specified and could not be determined from URL. A trailing slash (…/mcp/) counts as ambiguous too. v1 quietly fell back to SSE, so old scripts that "worked" against /api now fail. Pass --transport http explicitly and move on.
For OAuth-protected servers, the CLI supports real flows now (v1's CLI had none). The smoke-testing guide recommends --stored-auth-only in CI: it never opens a browser and fails fast with auth_required instead of hanging on a loopback callback. The default callback is http://127.0.0.1:6276/oauth/callback.
The CLI in CI
The CLI is where the Inspector earns its keep, because v2 gives you stable exit codes and a machine-readable error line. A minimal smoke job:
set -euo pipefail
I="npx --yes @modelcontextprotocol/[email protected] --cli"

# 1. Is it alive and speaking MCP?
$I node build/index.js --method initialize --format json > /dev/null

# 2. Does the tool we depend on exist?
$I node build/index.js --method tools/list --format json \
  | jq -e '.result.tools | map(.name) | index("get_temp")' > /dev/null

# 3. Does a safe, read-only call still work?
$I node build/index.js --method tools/call --tool-name get_temp \
  --tool-args-json '{"city":"Paris","units":"C"}' --format json \
  | jq -e '.result.structuredContent.unit == "C"' > /dev/null
Three details from the docs that are easy to miss:
- Pin the version.
@2isn't a pin, becausenpxwill resolve a newer 2.x tomorrow.--yesstops the first-run install prompt from hanging an unattended job. - Prefer
--tool-args-jsonfor typed arguments.--tool-arg zip=10001JSON-parses the value and sends the number 10001, which a string schema rejects.--tool-args-jsonsends exactly what you wrote. - Never pipe stderr into
jq. stdout is the result; stderr carries diagnostics, with the one-line error envelope last.
| Exit code | Meaning |
|---|---|
| 0 | Success |
| 1 | Usage or unexpected error |
| 2 | No MCP App on the tool (--app-info probe) |
| 3 | Server requires authentication |
| 4 | Server unreachable (DNS, refused, timeout) |
| 5 | Tool error: isError: true, or tool not found |
| 6 | --strict found an error-severity schema problem |
Exit 5 is the one that surprises people migrating from v1, where a failing tool call exited 0. If your pipeline "broke" after upgrading, a tool was probably failing all along. Read the class with tail -1 on the captured stderr and jq -r '.error.code'; our JSON formatter helps when you're staring at a big tools/list payload by hand.
Failures by symptom
Garbage on stdout. The spec says a stdio server MUST NOT write anything to stdout that isn't a valid MCP message, and messages are newline-delimited with no embedded newlines. A stray console.log in Node or a print() in Python breaks the stream. Log to stderr instead; the client may capture or ignore it, and per the spec it shouldn't treat stderr output as an error.
Works in the Inspector, fails in the client. Almost always environment. The MCP debugging guide points out that a client-launched server's working directory may be undefined (like / on macOS), so relative paths break, and that stdio servers inherit only a limited, platform-dependent set of environment variables. Use absolute paths for command and any file arguments, and pass secrets through the client's env block. The Filesystem MCP server config is a good example of an absolute directory argument.
Version or capability errors. The same guide lists the codes to look for: UnsupportedProtocolVersionError (-32022) lists the server's supported versions in its data field; a request missing io.modelcontextprotocol/protocolVersion or clientCapabilities in _meta gets -32602; and a server that needs a capability you didn't declare returns MissingRequiredClientCapabilityError (-32021). Check the request's _meta in the Protocol monitor against the server/discover response.
The Apps tab is blank in Docker or over SSH. The sandbox listens on 6275 and the browser reaches it directly, so you have to publish or forward that port as well as 6274.
Failures by client
Claude Desktop. Logs live in ~/Library/Logs/Claude on macOS, %APPDATA%\Claude\logs on Windows and ~/.config/Claude/logs on Linux. Follow them with tail -n 20 -F ~/Library/Logs/Claude/mcp*.log. After changing server code, fully quit and reopen the app; the guide notes that closing the window isn't enough.
Claude Code. claude mcp list and claude mcp get <name> show what's configured, and /mcp inside a session shows status and handles OAuth. The Claude Code MCP docs document MCP_TIMEOUT for slow-starting servers (MCP_TIMEOUT=10000 claude is a 10-second timeout) and say output over 10,000 tokens triggers a warning, with a default cap of 25,000 tokens adjustable through MAX_MCP_OUTPUT_TOKENS. They also explain that -- separates Claude's own options from the server command; forget it and your server's flags get parsed as Claude's. More habits are in our Claude Code tips post and on the Claude Code page.
VS Code. Run MCP: List Servers, pick the server and choose Show Output to open its output channel, per Manage MCP servers. The same page warns not to run a Docker stdio server in detached mode (-d), because the client needs the stdio connection. And don't paste a portable mcpServers file into VS Code's own format, which uses a servers key.
Don't expose the Inspector
The Inspector spawns processes and holds your OAuth tokens, so treat it like a shell. The web client README is blunt: the API token stops other origins from driving the backend through your browser, but GET / embeds the token, so anyone who can load the page can act as you. v2 refuses HOST=0.0.0.0 unless you set DANGEROUSLY_BIND_ALL_INTERFACES=true. In Docker, publish to loopback only:
docker run --rm -p 127.0.0.1:6274:6274 ghcr.io/modelcontextprotocol/inspector:latestSecrets go to the OS keychain where one exists; on headless Linux, SSH sessions and containers they fall back to ~/.mcp-inspector/secrets.json, unencrypted unless you supply a key, according to the README. Our MCP security guide covers the server side of the same problem.
A checklist before you blame the client
node -vsatisfies^22.23.4 || ^24.22.1 || >=26.12.1.- The server connects in the Inspector with the right
--protocol-era. - Nothing but JSON-RPC reaches stdout; logs go to stderr and show in Console.
tools/list --strictexits 0.- Each tool works with
--tool-args-jsonand realistic inputs. - The client config uses absolute paths and passes every env var the server reads.
- You've read the client's own log (Claude Desktop's
mcp*.log, VS Code's output channel,/mcpin Claude Code) before changing code.
Written by AIDToolStack Editorial
Researched from official documentation, specifications and vendor pages, listed under Sources below. Last checked November 2026.
Sources
- github.com/modelcontextprotocol/inspector
- github.com/modelcontextprotocol/inspector/blob/main/docs/v1-to-v2-migration.md
- github.com/modelcontextprotocol/inspector/blob/main/docs/mcp-server-configuration.md
- github.com/modelcontextprotocol/inspector/blob/main/docs/cli-smoke-testing.md
- github.com/modelcontextprotocol/inspector/blob/main/clients/tui/README.md
- github.com/modelcontextprotocol/inspector/blob/main/clients/web/README.md
- registry.npmjs.org/@modelcontextprotocol/inspector
- nodejs.org/en/blog/vulnerability/october-2026-security-releases
- modelcontextprotocol.io/specification/versioning
- modelcontextprotocol.io/specification/2026-07-28/changelog
- modelcontextprotocol.io/specification/2026-07-28/basic/transports
- modelcontextprotocol.io/specification/2026-07-28/basic/transports/stdio
- modelcontextprotocol.io/legacy/tools/debugging
- code.claude.com/docs/en/mcp
- code.visualstudio.com/docs/agents/run/manage-mcp-servers
- code.visualstudio.com/docs/copilot/customization/mcp-servers
Related Posts
Explore on AIDToolStack
Discover tools and servers featured in our directory.
AI Tools
MCP Servers
Sponsor Our Newsletter
Reach thousands of developers who are actively evaluating AI tools, MCP servers, and dev infrastructure. Our weekly newsletter goes to engaged technical decision-makers.
All sponsored content is clearly labeled per our editorial policy.