
Choosing Error Monitoring and APM: Sentry, Datadog, New Relic and Grafana Cloud
The usual way a team picks an error tracker is that someone installs one during an outage, and three years later nobody can remember why it's that one. Then the bill arrives with a line item nobody predicted, or a second team adds a different product for traces, and you're paying two vendors to tell you the same request was slow.
This guide compares the four names that come up most often, Sentry, Datadog, New Relic and Grafana Cloud, on the things that actually decide the choice: what each one bills you for, what the free tier really covers, and how well each takes OpenTelemetry data so you're not locked in. All prices are from the vendors' own pricing pages as of November 2026. They change often, so treat them as a snapshot and check before you sign anything.
If you're still setting up the basics (grouping, source maps, release tracking, alert noise), start with our error monitoring in production guide. This post assumes you know what you want to collect and are deciding where to send it.
The billing unit is the decision
Feature lists for these products overlap a lot. The pricing model doesn't, and it shapes your bill far more than any single feature.
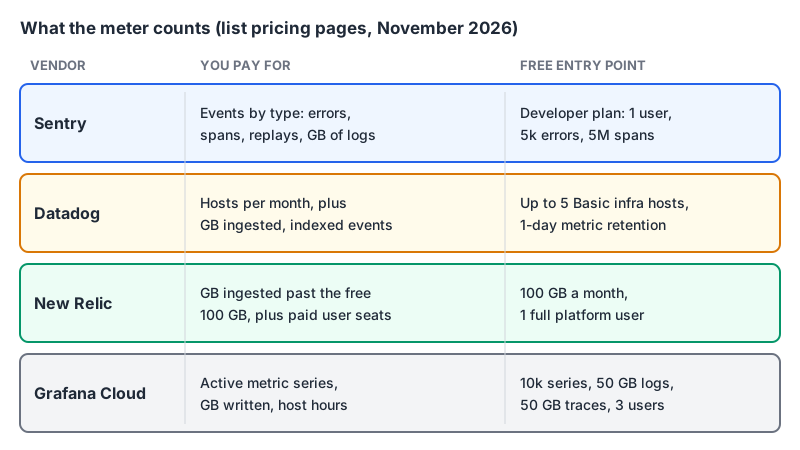
Sentry counts events by type. The pricing page lists a free Developer plan for one user with 5k errors, 5M spans, 50 session replays and 5 GB of logs a month. Team is $26 a month on annual billing ($29 monthly) and Business is $80 ($89 monthly). Both paid plans have unlimited users and start at 50k errors. Logs and application metrics beyond the quota are $0.50 per GB. Sentry's billing docs explain the part people miss: you can prepay reserved volume and set a pay-as-you-go budget, and once both are used up, further data is dropped and you aren't charged for it. That's a nice cost ceiling, and it also means you can go blind for the rest of the month during exactly the incident you needed data for.
Datadog counts hosts, then bytes and events on top. APM starts at $31 per host per month on annual billing with Infrastructure Monitoring attached, or $36 on demand, according to Datadog's pricing page. Each APM host includes 150 GB of ingested spans and 1 million indexed spans, pooled across hosts; extra ingestion is $0.10 per GB. Infrastructure Pro is from $15 per host annual ($18 on demand). Logs are split into ingest (from $0.10 per GB) and indexing ($1.70 per million events with 15-day retention, annual). Error Tracking on its own is $25 a month annual for up to 50k errors, and it's included at no extra cost for errors that arrive through APM traces and RUM sessions. The free option is limited to five Basic infrastructure hosts with one-day metric retention.
New Relic counts gigabytes and seats. The pricing page gives every account 100 GB of ingest a month free, one full platform user and unlimited basic users. Past 100 GB, ingest is $0.40 per GB (or $0.60 on the Data Plus option). Full platform users are where the money goes: on Standard it's $10 for the first and $99 for each additional, capped at five; on Pro it's $349 per user with an annual commitment. Core users are $49.
Grafana Cloud counts series, bytes and host hours. The free tier includes 10k active metric series, 50 GB each of logs, traces and profiles, 14-day retention and three active users. Pro has a $19 monthly platform fee; metrics start at $6.50 per 1k series, and logs and traces are priced in three parts per GB (processing from $0.05, write $0.40, retention $0.10). Application Observability is $0.025 per host hour, which Grafana translates to roughly $18 per host.
| Free tier, short version | Scales with | What surprises people | |
|---|---|---|---|
| Sentry | 1 user, 5k errors, 5M spans | Error, span and replay volume | Data is dropped once budget runs out |
| Datadog | 5 Basic hosts, 1-day metrics | Hosts, then GB and indexed events | Separate meters for ingest and indexing |
| New Relic | 100 GB/month, 1 full user | GB ingested and full users | Seat price, not data, often dominates |
| Grafana Cloud | 10k series, 50 GB logs and traces | Active series and GB written | Label cardinality inflates series count |
Match the meter to your shape
Once you see the billing units side by side, the fit mostly follows from what your system looks like.
Lots of users, few hosts, frontend-heavy. A web app with a busy browser client and a handful of backend instances throws a lot of errors relative to its infrastructure. Sentry's per-event model and unlimited seats on Team suit this well. You care about stack traces, source maps and replay, and you don't want to pay per developer who opens the dashboard.
Many hosts or containers, and an ops team. If you already run dozens of nodes and want infrastructure metrics, APM, logs and dashboards in one place, Datadog's per-host model is at least predictable per machine. The catch is the stack of meters on top: indexed spans, indexed log events and containers above the per-host allowance (5 per host on Pro, 10 on Enterprise) all bill separately. Get someone to own the usage page.
Moderate data, a small number of people who need full access. New Relic's 100 GB free allowance is generous for a small production system. If only two or three engineers need the full product, the Standard plan's $10 first user and $99 for each extra is easy to budget. It gets expensive when the whole engineering org wants full platform seats.
You already run Prometheus, or want open formats end to end. Grafana Cloud bills by active series, which maps directly to what you already measure in Prometheus. The trap here is label cardinality: put a user ID or request ID in a metric label and your series count, and bill, grows with your traffic. Our logging for small apps post covers keeping high-cardinality data in logs instead.
These aren't exclusive. One workable split is Sentry for application errors and a metrics-first backend for infrastructure. Our Sentry vs Datadog comparison goes through where those two overlap, and Datadog vs New Relic covers the two full-platform vendors head to head.
OpenTelemetry is your exit strategy
The best protection against a bad pricing surprise is being able to move. If you instrument with OpenTelemetry SDKs and send through a collector, switching backends becomes a config change rather than a rewrite of every service. All four vendors take OTLP in some form, but not equally.
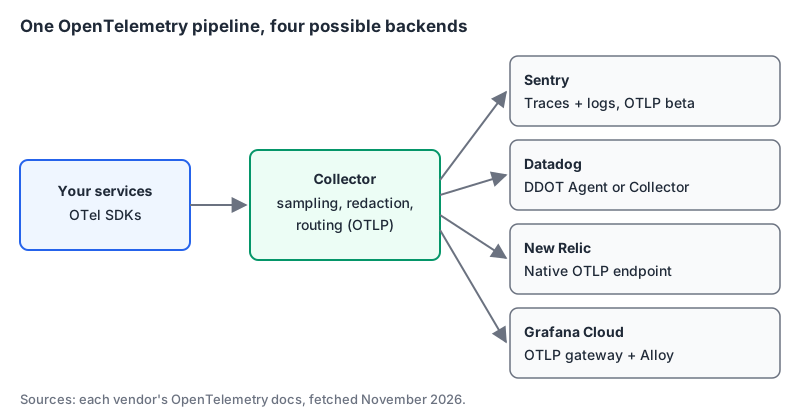
- New Relic says it "supports native OTLP ingest and recommends it as the preferred method". The US endpoint is
https://otlp.nr-data.netand the EU one ishttps://otlp.eu01.nr-data.net. Its docs recommend OTLP over HTTP with binary protobuf rather than gRPC, because long-lived HTTP/2 connections get mangled by some proxies and load balancers. Payloads must stay under 1 MB. - Grafana Cloud calls its OTLP gateway the recommended endpoint for metrics, logs and traces, and recommends running Grafana Alloy as a collector in production for retries, enrichment, sampling and redaction. One gotcha from its docs: if you set a signal-specific variable such as
OTEL_EXPORTER_OTLP_TRACES_ENDPOINT, the SDK uses the URL exactly as given and won't append/v1/tracesfor you. - Datadog lists several routes in its OpenTelemetry docs: the Datadog Agent with its embedded DDOT Collector (the recommended one), a standard OpenTelemetry Collector exporting to Datadog, and direct OTLP ingestion for serverless and managed platforms where you can't run an agent.
- Sentry accepts OpenTelemetry traces and logs over OTLP, but the feature is in open beta and "Sentry does not support OTLP metrics at this time." In practice most teams still use Sentry's own SDKs for error capture, since that's where its stack-trace grouping comes from.
A minimal exporter setup is the same shape whichever backend you choose. With the standard environment variables:
export OTEL_SERVICE_NAME=checkout-api
export OTEL_EXPORTER_OTLP_PROTOCOL=http/protobuf
export OTEL_EXPORTER_OTLP_ENDPOINT=https://otlp.nr-data.net
export OTEL_EXPORTER_OTLP_HEADERS="api-key=${NEW_RELIC_INGEST_KEY}"
Point the same services at Grafana Cloud and only the endpoint and header values change (Grafana's portal generates them from the OpenTelemetry tile on your stack). If you'd rather keep the vendor's address out of every service, run a collector, point services at it, and change the exporter in one place.
Gotchas before you commit
- Sampling decides the bill on span-priced plans. Sentry bills spans, Datadog bills indexed spans past the per-host allowance, Grafana bills trace bytes. Sample at the collector, keep 100% of errors and slow requests, and cut the rest.
- Retention isn't the same across plans. Grafana Cloud free keeps 14 days; Sentry Developer gives a 30-day lookback; Datadog's free infrastructure tier keeps metrics for one day. If you investigate incidents a few weeks after the fact, check the retention, not just the volume.
- Seats compound. On New Relic, every engineer who needs full access is a line item. On Sentry Team and Business, users are unlimited. On Grafana Cloud's free tier, it's three active users.
- Logs are the usual blowout. Debug logs left on in production are the fastest way to multiply any of these bills. Datadog's split between ingest and indexing helps here, since you can ingest and archive without indexing everything.
- Hitting a hard cap is a design choice. Sentry's drop-after-budget behaviour protects your card but costs you data mid-incident. Decide in advance which you'd rather do: overspend, or go blind.
There's also an AI-assistant angle now: there are MCP servers for all four products, so you can query errors and traces from your editor. Our observability MCP roundup covers the Sentry MCP server and the others, and which ones stay read-only.
The decision rule
- If your main pain is application errors and you want unlimited seats with a predictable monthly bill, start with Sentry Team and add a metrics backend only when you need one.
- If you run a fleet of hosts or containers and want one vendor for infrastructure, APM and logs, pick Datadog, and assign an owner to the usage page from day one.
- If a few engineers need the full product and your data volume is moderate, New Relic's 100 GB free tier goes a long way.
- If you already use Prometheus and Grafana, or want open formats everywhere, go with Grafana Cloud and police label cardinality.
- Whichever you choose, instrument with OpenTelemetry and run a collector, so the next migration is a config change.
Written by AIDToolStack Editorial
Researched from official documentation, specifications and vendor pages, listed under Sources below. Last checked November 2026.
Sources
- sentry.io/pricing/
- docs.sentry.io/pricing/
- www.datadoghq.com/pricing/
- newrelic.com/pricing
- grafana.com/pricing/
- docs.newrelic.com/docs/opentelemetry/best-practices/opentelemetry-otlp/
- grafana.com/docs/grafana-cloud/send-data/otlp/send-data-otlp/
- docs.datadoghq.com/opentelemetry/
- docs.sentry.io/concepts/otlp/
Related Posts
Explore on AIDToolStack
Discover tools and servers featured in our directory.
AI Tools
MCP Servers
Sponsor Our Newsletter
Reach thousands of developers who are actively evaluating AI tools, MCP servers, and dev infrastructure. Our weekly newsletter goes to engaged technical decision-makers.
All sponsored content is clearly labeled per our editorial policy.