
Uptime Monitoring and Status Pages: What to Check and What It Costs
The worst way to learn your site is down is from a customer. The second worst is from your own logs, because logs only exist for requests that reached you. If DNS points at the wrong place, the certificate expired at 02:00, or the server never came back after a reboot, there's nothing to log. You need something outside your infrastructure that keeps asking "does this work?" and complains when the answer changes.
That's uptime monitoring. A status page is its public half: the place you tell users what's going on so they stop guessing. This post covers what to check, how to build a health endpoint that doesn't lie, why certificate expiry is about to get more frequent, and what the main services cost as of November 2026. For the inside-out view, see our posts on logging for small apps and error monitoring.
What an outside check actually tests
A single request to https://example.com/ passes through several layers, and each one fails differently. It helps to monitor them separately so the alert tells you which one broke.
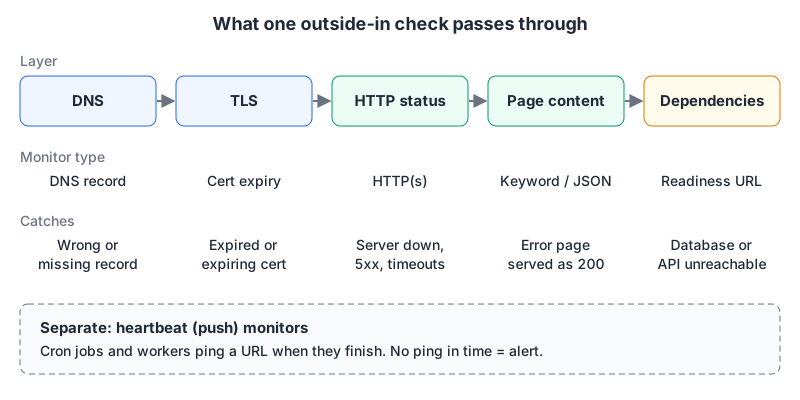
- DNS. Does the name resolve, and to the right address? A DNS monitor catches a deleted record or a registrar mistake before it looks like "server down". Uptime Kuma has a dedicated DNS record monitor type. Our DNS lookup tool is handy for checking by hand, and DNS records explained covers what each record does.
- TLS. Is the certificate valid, and how long until it isn't? More on this below.
- HTTP status. The basic check. Note what counts as "up": Kubernetes, for example, treats any code from 200 to 399 as success for an HTTP probe. Most uptime services let you pick.
- Content. A 200 that renders "Something went wrong" is still an outage. Keyword monitors look for a string that only appears when the page worked; JSON monitors check a field in an API response. Uptime Kuma supports both.
- Dependencies. Is the database reachable from the app? This is where a health endpoint comes in.
Separately, there's the stuff nobody requests: cron jobs, queue workers, backups. Those get heartbeat (push) monitors, where the job calls a URL when it finishes and silence triggers the alert. Uptime Kuma calls these Push monitors; Better Stack calls them heartbeats. The cron jobs best practices post goes deeper on monitoring scheduled work.
A health endpoint that tells the truth
Kubernetes' probe documentation is the clearest primary source on what health checks should mean, even if you never run Kubernetes. It defines three kinds of probe:
- Liveness: should this process be restarted? It catches states like a deadlock.
- Readiness: should this instance receive traffic right now?
- Startup: has the app finished starting? Other probes wait for it.
The docs warn that liveness probes "should be used with caution" and that a bad one can cause cascading failures, such as restarting containers under high load. Their recommended split: liveness passes when the app itself is healthy; readiness also checks each required back end. So don't put a database query in the endpoint that triggers restarts, or one slow query storm will restart every instance at once.
For an external uptime monitor, the readiness-style endpoint is the one to watch, because "the app is up but can't reach its database" is an outage from the user's side.
There's no ratified standard for the response body. The closest thing is an IETF draft, Health Check Response Format for HTTP APIs, which defines application/health+json with a status of pass, fail or warn, and requires 2xx-3xx for pass and warn and 4xx-5xx for fail. Be aware it's an expired individual draft (revision 06, from 2021) with no formal standing. I still like its status-to-HTTP-code rule, because it means a dumb monitor that only reads the status code gets the right answer:
// Express-style readiness endpoint, loosely following draft-inadarei-api-health-check
app.get("/health/ready", async (req, res) => {
  const checks = {};
  try {
    await db.query("SELECT 1");
    checks["db:connection"] = [{ status: "pass" }];
  } catch (err) {
    checks["db:connection"] = [{ status: "fail", output: "unreachable" }];
  }
  const failed = Object.values(checks).flat().some((c) => c.status === "fail");
  res
    .status(failed ? 503 : 200)
    .type("application/health+json")
    .set("Cache-Control", "no-store")
    .json({ status: failed ? "fail" : "pass", checks });
});
Keep the output vague on public endpoints. Connection strings and stack traces in a health response are a gift to anyone scanning you. The HTTP status code reference is useful for picking 503 over 500 here: 503 says "temporarily unable", which is what a failed dependency is.
Certificate expiry is about to happen a lot more often
If you use automatic renewal, you might think expiry monitoring is redundant. Two changes say otherwise.
First, the CA/Browser Forum passed Ballot SC-081v3 in April 2025, cutting the maximum lifetime of public TLS certificates from 398 days to 47 days in stages. The Baseline Requirements list the dates:
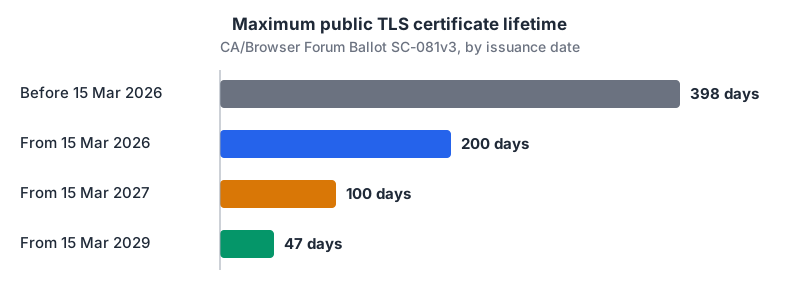
We're already in the 200-day era. Shorter lifetimes mean more renewals, and every renewal is a chance for automation to fail quietly: a changed DNS provider API token, a firewall that now blocks port 80, a container that lost its volume.
Second, Let's Encrypt announced in January 2025 that it would stop sending expiration reminder emails on 4 June 2025, and pointed people to third-party monitoring instead. If you relied on those emails as your safety net, it's gone.
Most uptime services can alert on certificate expiry. For a quick manual or cron-based check, OpenSSL does it in one line. -checkend takes seconds and, per the OpenSSL x509 docs, exits non-zero if the certificate expires within that window:
# Print the expiry date
echo | openssl s_client -connect example.com:443 -servername example.com 2>/dev/null \
  | openssl x509 -noout -enddate

# Exit 1 if it expires within 14 days (1209600 seconds)
echo | openssl s_client -connect example.com:443 -servername example.com 2>/dev/null \
  | openssl x509 -noout -checkend 1209600 || echo "renew soon"
Our SSL checker does the same from a browser, and SSL/TLS certificates explained covers chains and renewal if you want the background.
The services, compared
Prices are from each vendor's pricing page as of November 2026. Free tiers change often, so check before you commit.
| Service | Free tier | Paid entry point | Notes |
|---|---|---|---|
| UptimeRobot | 50 monitors, 5-minute checks, 1 basic status page | Solo from €9/month (annual), 60-second checks | Free plan explicitly allows commercial use |
| Better Stack | 10 monitors and heartbeats, 1 status page | $29/month per responder seat (annual) | Extra 50 monitors $21-25/month; status page add-ons priced separately |
| Checkly | 10 uptime monitors, 2-minute frequency, 10k API and 1k browser check runs | Starter $24/month | Playwright-based browser checks; Hobby is hard-capped |
| Uptime Kuma | Self-hosted, MIT licence | Your server's cost | HTTP, keyword, JSON, DNS, push, Docker and more; multiple status pages |
Uptime Kuma's current release is 2.5.9, from 31 October 2026. Installing it is one container:
docker run -d --restart=always -p 3001:3001 -v uptime-kuma:/app/data --name uptime-kuma louislam/uptime-kuma:2The obvious catch with self-hosting your monitor: if it runs on the same server or network as the thing it watches, they go down together and you hear nothing. Put it somewhere else, ideally a different provider, or pair it with a free hosted plan that watches the monitor itself.
Status pages
A status page needs to be up when you aren't, which is the strongest argument for a hosted one. Dedicated options, as of November 2026:
- Atlassian Statuspage: free public page with 100 subscribers and 25 components; paid public pages start at $29/month (Hobby, 250 subscribers) and go up to $1,499/month. Private pages for internal audiences start at $79/month.
- Instatus: free plan with 15 monitors at 2-minute checks, 200 subscribers and no custom domain; Pro is listed from $20/month with a custom domain and 30-second checks.
- UptimeRobot, Better Stack and Uptime Kuma all include status pages too, which is often enough for a small product.
Whatever you use, a few things make a status page worth visiting:
- Components users recognise. "Checkout" and "API", not "pg-primary-2".
- Updates with times and a next update time. "Investigating, next update by 14:30 UTC" beats silence.
- A custom domain on separate DNS where you can. If
status.example.comlives on the same DNS setup as the broken thing, a DNS outage takes both down. - Subscriptions. Email or webhook notifications mean fewer "is it down?" tickets.
A setup for a small app
If you run one app and want something sensible this afternoon:
- An HTTP keyword monitor on the home page and one on your main API path, at the shortest interval your plan allows.
- A readiness endpoint that checks the database and returns 503 when it can't, monitored separately so the alert names the cause.
- Certificate expiry alerts at 14 days, and a DNS monitor on the apex and
www. - A heartbeat for every cron job and backup.
- Alerts that reach a phone, not just an inbox you read on Mondays.
- A hosted status page that doesn't share infrastructure with your app.
If two of those already exist, add the heartbeats next. Silent job failures are the ones that turn into data loss.
Written by AIDToolStack Editorial
Researched from official documentation, specifications and vendor pages, listed under Sources below. Last checked November 2026.
Sources
- github.com/louislam/uptime-kuma
- kubernetes.io/docs/tasks/configure-pod-container/configure-liveness-readiness-startup-probes/
- kubernetes.io/docs/concepts/configuration/liveness-readiness-startup-probes/
- datatracker.ietf.org/doc/draft-inadarei-api-health-check/
- cabforum.org/2025/04/11/ballot-sc081v3-introduce-schedule-of-reducing-validity-and-data-reuse-periods/
- cabforum.org/working-groups/server/baseline-requirements/requirements/
- letsencrypt.org/2025/01/22/ending-expiration-emails/
- docs.openssl.org/3.0/man1/openssl-x509/
- uptimerobot.com/pricing/
- betterstack.com/pricing
- www.checklyhq.com/pricing/
- github.com/louislam/uptime-kuma/releases
- www.atlassian.com/software/statuspage/pricing
- instatus.com/pricing
Related Posts
Explore on AIDToolStack
Discover tools and servers featured in our directory.
AI Tools
MCP Servers
Sponsor Our Newsletter
Reach thousands of developers who are actively evaluating AI tools, MCP servers, and dev infrastructure. Our weekly newsletter goes to engaged technical decision-makers.
All sponsored content is clearly labeled per our editorial policy.